Where do the numbers on the Financial Benefits page come from?
The Financial Benefits calculated based on the tariffs that you input. You can take a look at how to create and manage your tariffs here.
Here is a breakdown of the figures on the graph given on the Financial Benefits page of the Customer Proposal.
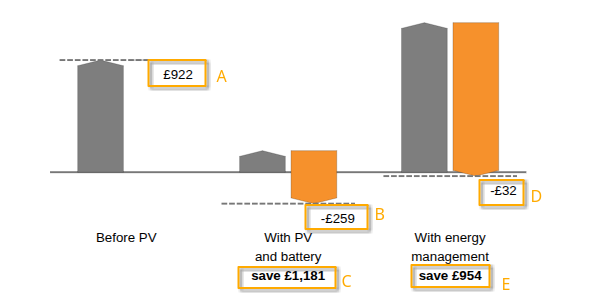
A - The total cost per year before the PV system.
B - The cost after PV and battery including savings from exporting (In this case, a negative number because they will actually be making a profit).
C - The difference between the original cost before PV & battery and after.
D - The export profit with energy management (overnight charging).
E - The difference between how much you pay for energy before solar and what you 'pay' after energy management.