Consumption task
This guide applies to the easy-pv.co.uk and easy-pv.ie versions of Easy PV.PV, references to MCS only apply to the UK site. The information provided here may not be accurate for easy-pv.com.
The consumption task is an accepted alternative to the MCS performanceself-consumption tablecalculation completed in the performance task. Unlike with MCS, the Easy PV self consumption task can be used for projects larger than 6000 kWh and with batteries larger than 15.1 kW.
If you would like to use the Easy PV self-consumption calculationcalculations as the basis for your financial projections and in yourthe project,customer proposal, make sure it is selected in the financial task.
Getting started with the Consumption task
You can access the consumption task via the 'Tasks' drop-down menu or from the task list to the left on the project overview page.
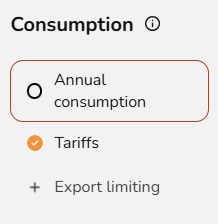
When the consumption task first opens, you'll be shown a popup that lets you configure the settings you want to use for calculating generation and consumption of the system. It will open on the 'Annual consumption' and then you can use the left hand navigation to choose the settings you want to edit. More information on each of the settings is available below.
When you have finished configuring these inputs, click Save & Exit. This will close the settings popup and allow you to view and modify the quotation, or click to view the projections.
If you want to edit the inputs, click on the pencil icon in the top right of the page to re-open the consumption task settings popup.
Navigating the Consumption task
Once you have configured the Consumption task inputs and submitted them, you can then explore the calculated information.
The left hand side shows the full results of the consumption task calculations and detailed insights. Read the 'View and understand the calculated consumption task data section' of this guide for more information about what's included.
The right hand sidebar on the page includes options to help you navigate through the different sections of insights.
It also allows you to:
|
Edit inputs
Update the annual consumption, tariffs and export limitation used for the calculations. |
|
|
Show inverter clipping
Choose whether to show and hide the inverter and export limitation clipping on the generated graphs. |
 |

View and understand the calculated consumption task data
Once you have configured the consumption task inputs and submitted them, you can then explore the estimated PV generation, how energy will be consumed by the property, how much energy is imported and exported, the financial benefits and information about battery usage (if a battery is included). This includes annual insights and charts to show changes through the year and over the course of each day.
The left hand side of the page allows you to navigate to the different sections of the consumption data and also shows detailed insights, and the right hand side of the page shows info the calculations are based on. You can use the toggle on the right side menu to show and hide the inverter and export limitation clipping on the generated graphs.
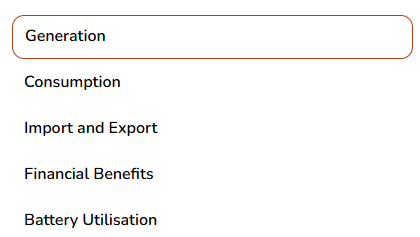
Generation
This shows the estimated annual generation of the system and whether the generated energy is used directly in the house, used to charge the battery or exported to the grid. It will also show inverter and export limitation clipping if you've turned on this toggle.
Consumption
This shows the total annual energy consumption of the property and where this energy will come from. It shows how much energy is expected to be supplied directly from the solar array, via the battery or imported from the grid.
Import and export
This shows the likely flow of energy to and from the grid over the course of a year. It's likely that there will be more energy exported during summer when the solar array is generating more energy, and more energy will be imported from the grid during winter months.
Financial benefits
This shows the money spent and earned on electricity flowing to and from the grid over the course of a year. It allows you to see the total money earned from export payments versus the money spent on imports, and how would compare to having no solar installed.
Battery utilisation
This helps you understand the modelled utilisation of the battery over the course of the year based on the amount of the the available battery capacity that is actually charged and discharged each day. Utilisation of over 100% is possible at times where a battery is charged and discharged more than once during a day. Low battery utilisation can be due to either insufficient PV generation to charge the battery (often the case in winter, or on cloudy days), or because loads are small overnight and the battery does not fully discharge. If you have low battery utilisation you may want to reduce the size of the batteries or recommend forced charging of the batteries on an overnight tariff to the property owner.
Edit the consumption task inputs
Set the annual consumption
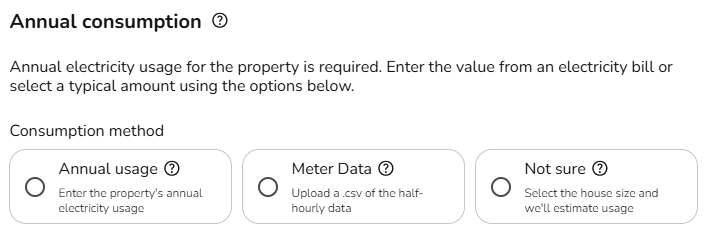
There are a number of options for addingsetting the annual consumption.
Option 1: Annual usage: If you know the annual consumption in kWh (for example from an electricity bill) you can enter it
viahere in the'Annualannualusage'usage field.When you use this option
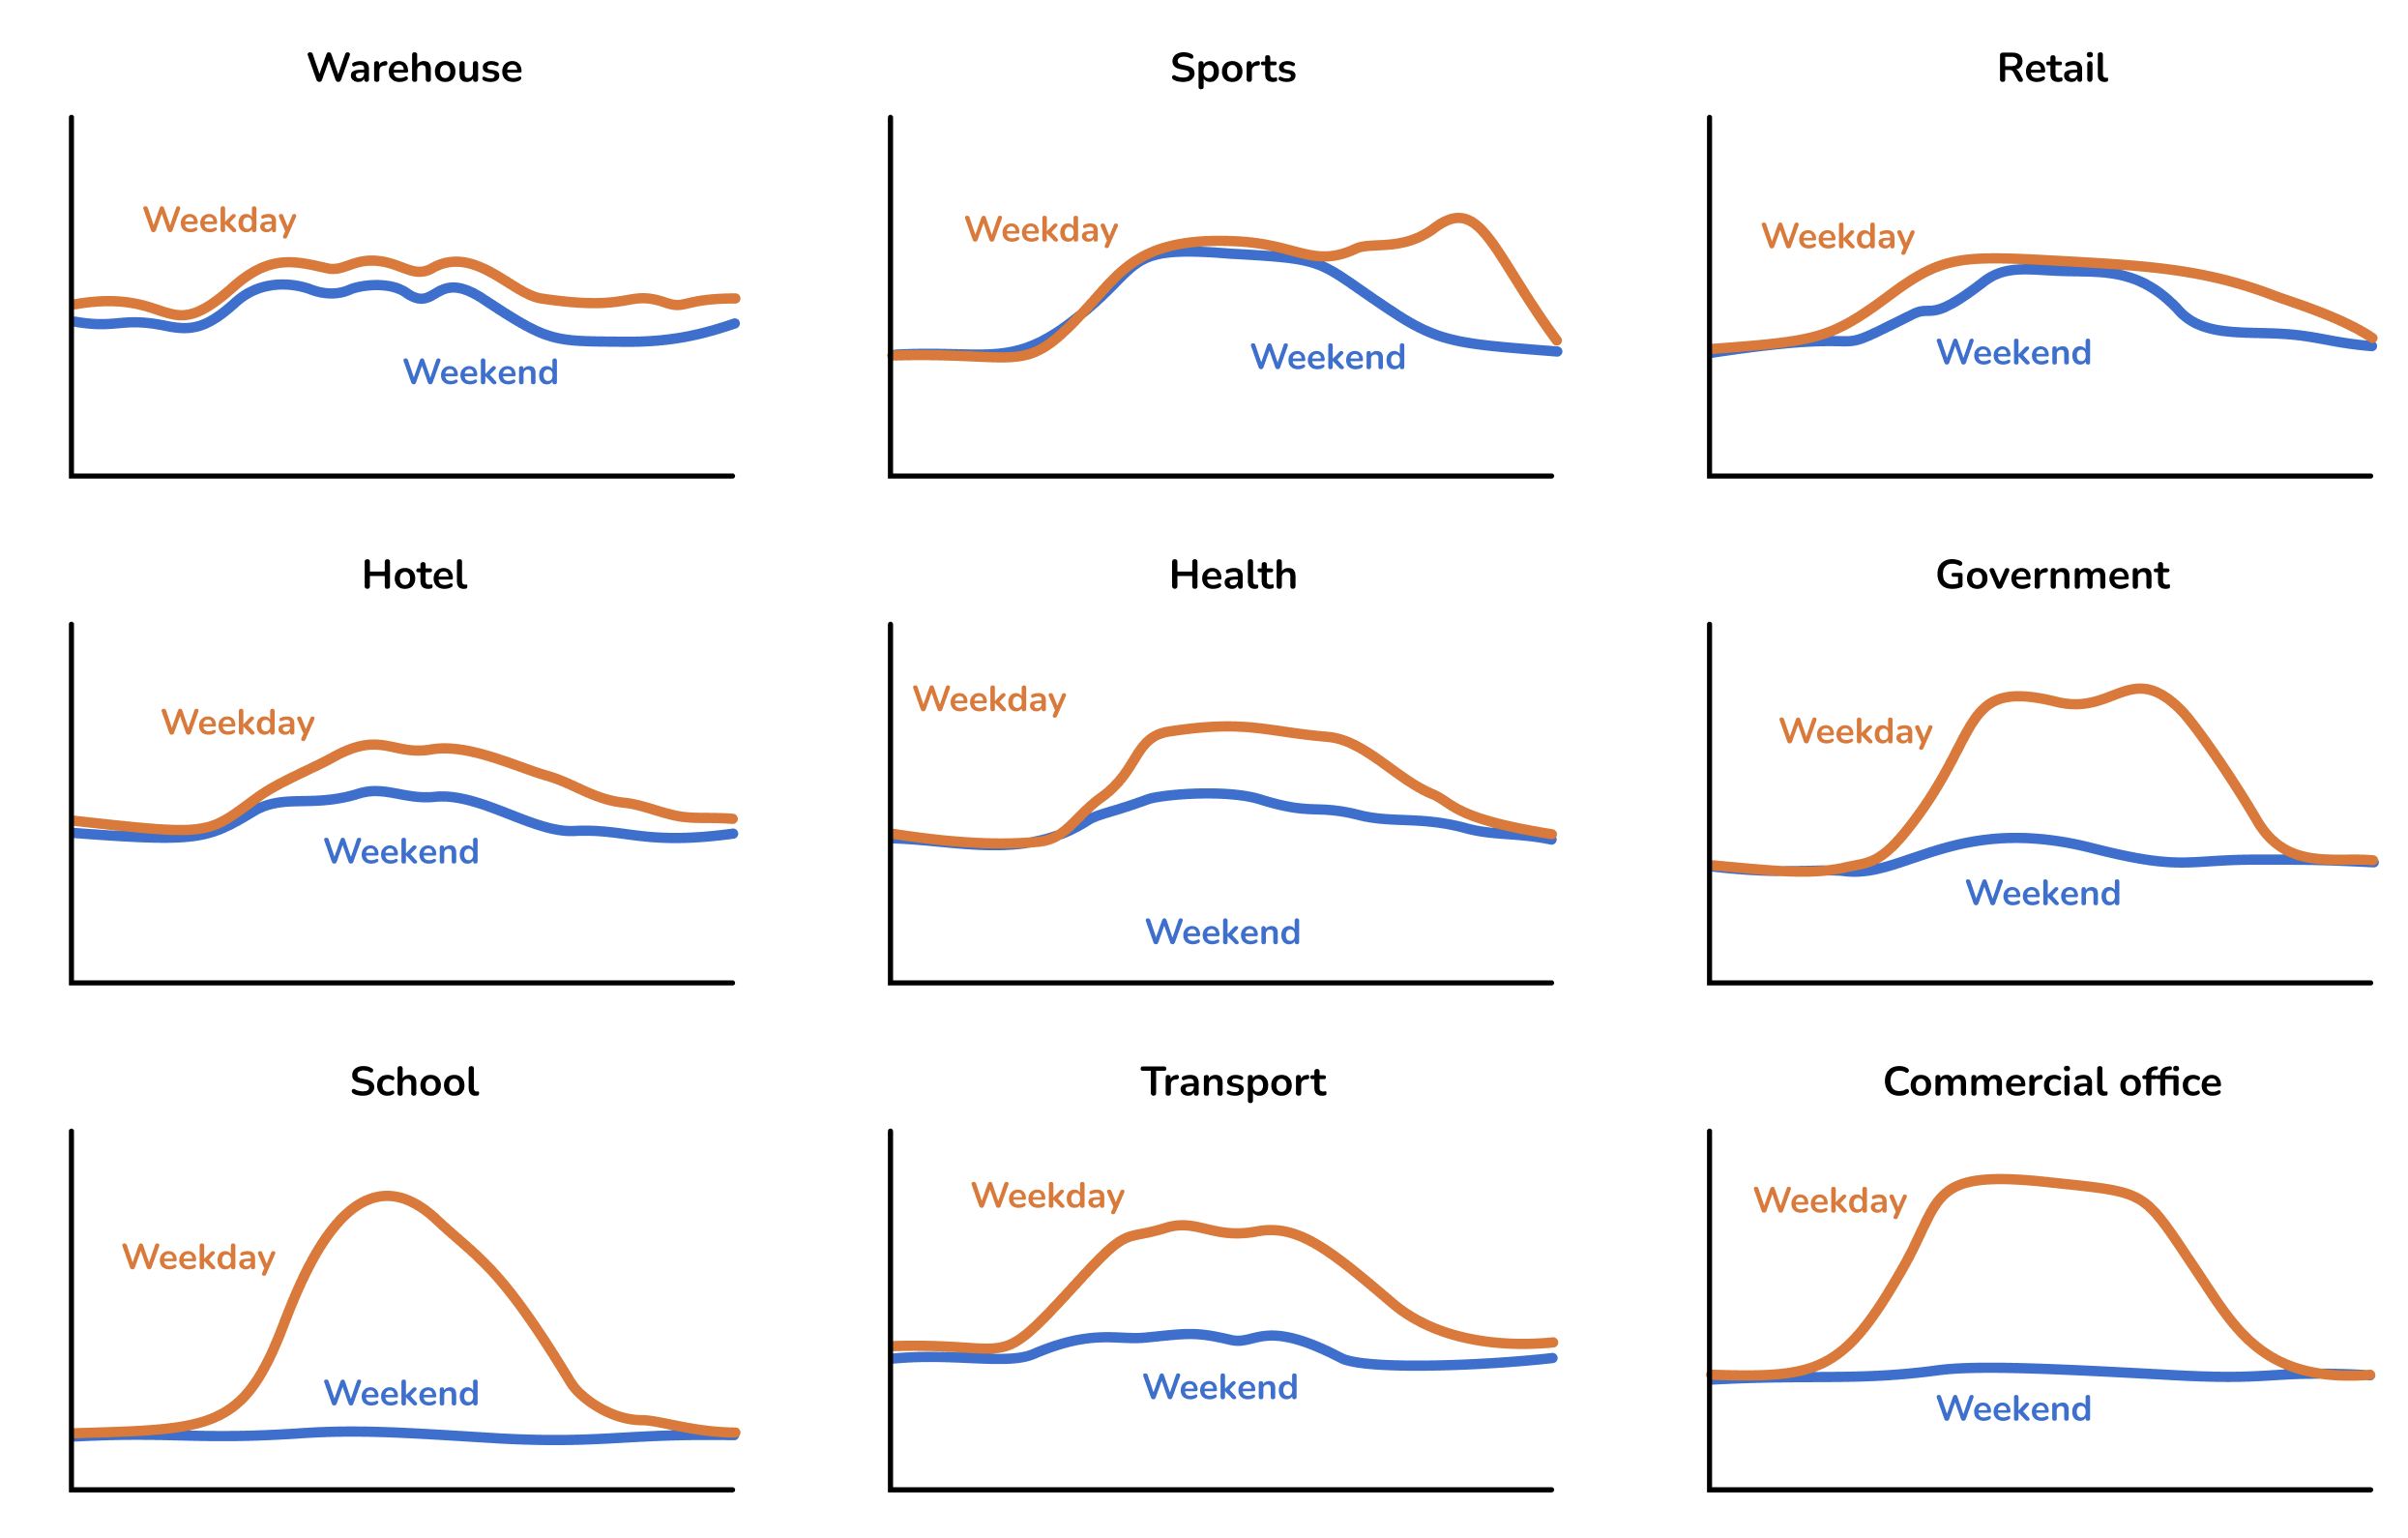
- you can now choose from a variety of domestic and commercial consumption profiles to build an accurate picture of energy usage throughout the year. A consumption profile calculates when energy is consumed—both annually and on a daily basis. For example, in a domestic home, most energy is typically used in the early morning and evenings. In contrast, an office profile reflects higher energy use during typical working hours, from around 09:00 to 17:00. The following commercial profiles are available

Option 2: Meter data: If the property has a smart meter
andyou can upload half-hourly data to get a more accurate projections.This option is especially useful for commercial properties where consumption patterns differ greatly from domestic properties.
The data should ideally span at least ayear,yearand(butmustifbeit contains a minimum of 6 months, althoughour algorithm will automatically attempt to fill insmallgaps where they aredetected.detected).
The file must have a .csv file extension. If your data is in another format you can export it as csv from Excel, Google Sheets, Libreoffice or any other spreadsheet editor.
Note that there are many different CSV formats for smart meter data, and we don't support all of them yet. If your upload doesn't work,
you are welcome toplease send us the spreadsheet at help@easy-pv.co.uk or help@easy-pv.ie and we will see if we can add the format. - You can also download our sample spreadsheet here and change your data into this format.
Option 3: Not sure: If you don't know the electricity consumption in the
property,property and it's domestic, you can use a typicalvaluevalues for the size ofproperty.property provided here.
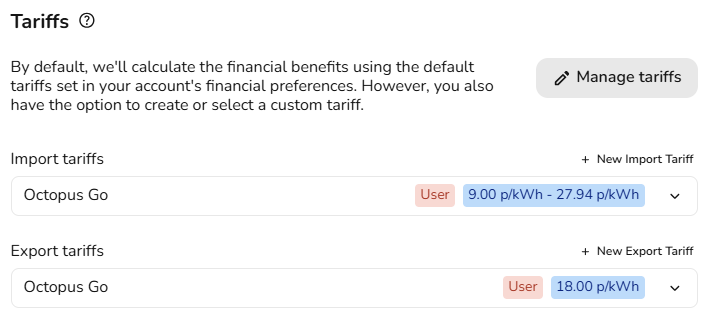
Set Tariffsthe import and export tariffs
Here you should select the tariffs this project will use. It is important to set suitable tariffs so the financial calculations for this project are accurate. By default, we'll calculate the financial benefits using your default flat tariffs which you can specify in your financial settings. Alternatively, you can create and select youra ownnew tariffstariff by selecting 'Create+ aNew new tariff' under import and import/export tariffs.
See Click here for a full guide on creating tariffs in Easy PV.
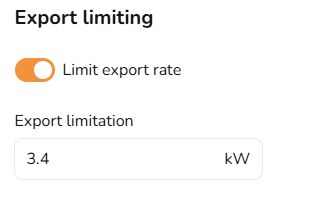
Self-consumptionApply calculationexport limitation
OnceIn this section you arecan happy withlimit the consumptionexport rate if this is required by the DNO. Switch the toggle on and tariffs, select submit. You can then explore howinput the PV generation, consumption within the property, state of charge of the battery (if a battery is included) and import andannual export oflimit electricityin from the property change through the seasons and over the course of each day.kW.
To edit consumption task inputs, select the pen icon in the top right corner.