Understanding the Consumption task (WIP)
To do:
background on how it worksdifferences with MCSgive more helpful descriptions for each section and how they can be used
How does the consumption task estimate self-consumption?
Whats
The consumption task compares the differenceoutput betweenof MCSthe and Easymodelled PV self-consumption calculations?
System sizeMCS: can be used for projectssystem withconsumptionthebetweenconsumption.1500-6000kWh,Togenerationdobelowthis6000kWhweand usable batter capacity below 15.1kWh.Easy PV: can be used for any system size and consumption level.
Consumption profilesMCS: choice between domestic consumption profiles: home all day, home halftake theday and out all day.Easy PV: additional choices betweencommercial consumption profiles. You also have the option of uploading half-hourly meter data to ensure the consumption profile is entirely accurate to the customer's usage.
MethodMCS: calculates the annual generation and the self-consumption is determined based on lookup tables.Easy PV: uses the sametotal generation figurebutfromthentheusesperformancePVGIStaskdata toand modelhowthisis distributedacross theyear.year using a PVGIS generation profile. This profile is based on the number of panels, where they are in world and which orientation they are facing. We then compare this against the selected consumption profile.Using these profiles Easy PV then
calculates stepslooks minute by minute over the course of theyear, lookingyear at how much is being generated, how much is being consumed and how charged the battery is anddivertingdiverts the energy accordingly, factoring in the charge rate of the battery.
The
self-consumption Additionalisoptionsthen- calculated
Sincebased on the proportion of electricity generated that is consumed on the property (directly or via the battery).Whats the difference between MCS and Easy PV
calculatesself-consumptionhowcalculations?MCS (UK only) Easy PV Easy PV task Completed at the
generatedendelectricityofisPerformanceusedtask, select MCS in Financial task to useCompleted in Consumption task, select Easy PV in Financial task to use.
System size Consumption: 1500-6000kWh
Generation: <6000kWh
Usable batter capacity: <15.1kWh
Any consumption, generation or battery capacity
Consumption profile Domestic profiles: home all day, home half the day and out all day Domestic, commercial consumption profiles or
half-hourly data from customer
Method Compares annual generation and determines self-consumption based on look-up tables. Compares generation and consumption profiles minute-by-minute ratheracrossthantheannually,year to determine self-consumptionAdditional options Limited since it only compares annual figures. Minute-by-minute calculation means export limits, inverter clipping, variable tariffs and forced charging/discharging of batteries can beare factored intothecalculationsmodel.
For
Understanding consumption data
Once you have configured the Consumption task inputs and submitted them, you can explore the calculated information.
The left-hand side shows the full results of the consumption task calculations with interactive graphs and detailed insights. For each section, the top graph gives you the annual figures in kWh and the lowerbottom graph gives daily figures.figures in kW.
All graphs use the following key to help you understand the generated data:
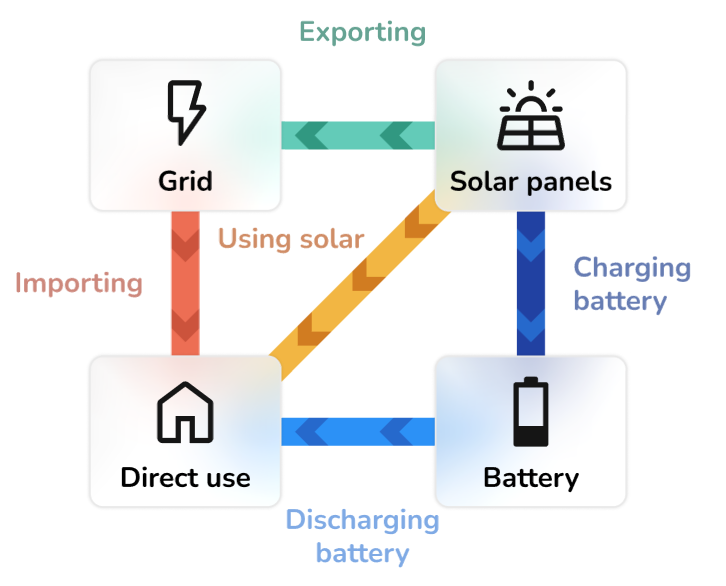
Generation
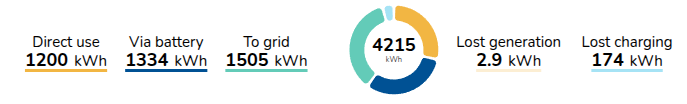
- This shows the estimated annual generation of the system and whether the generated energy is used directly in the house, used to charge the battery or exported to the grid.
- It will also show inverter and export limitation clipping if you've turned this on.
NavigateBottombetweengraphthecandateshelp understand export rates, export clipping or inverter clipping, with figures given inthekWlower graph to see daily insights.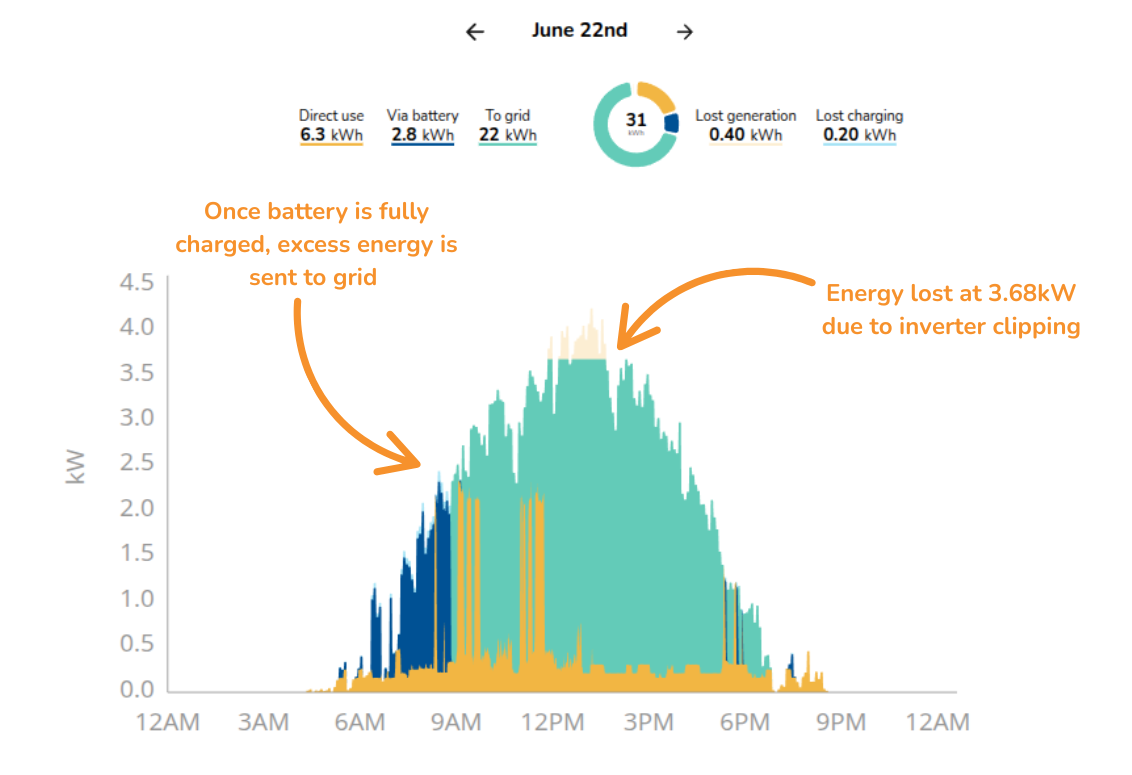

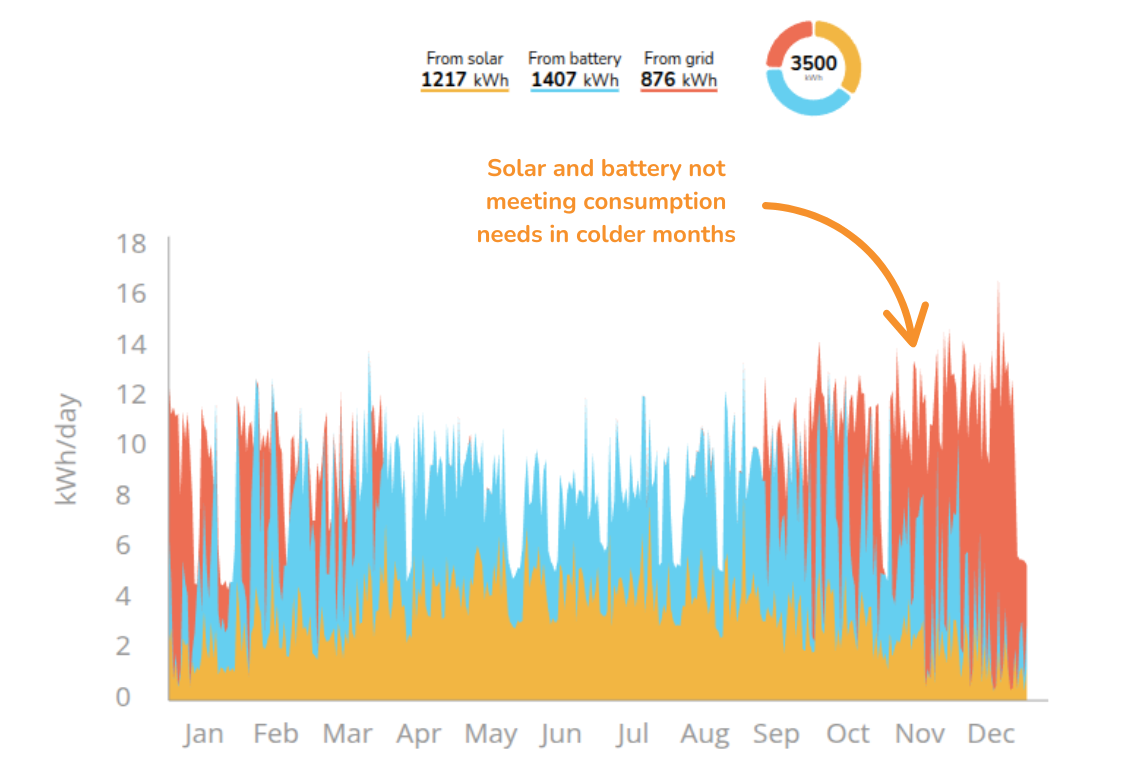
Consumption
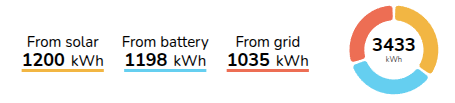
- This shows the total annual energy consumption of the property and where this energy will come from.
- It shows how much energy is expected to be supplied directly from the solar array, via the battery or imported from the grid.
- Top graph useful to see how consumption is being met at different point in the year

Import and export
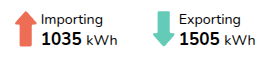
- This shows the likely flow of energy to and from the grid over the course of a year.
- It's likely that there will be more energy exported during summer when the solar array is generating more energy, and more energy will be imported from the grid during winter months.
Financial benefits
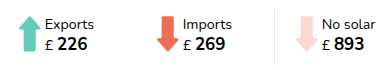
- This shows the money spent and earned on electricity flowing to and from the grid over the course of a year based on selected tariffs.
- It allows you to see the total money earned from export payments versus the money spent on imports, and how would compare to having no solar installed.
If you would like to use the Easy PV self-consumption calculations as the basis for your financial projections in the customer proposal, make sure it is selected in the financial task.
Battery utilisation
- This helps you understand the modelled utilisation of the battery over the course of the year based on the amount of the the available battery capacity that is actually charged and discharged each day.
- Utilisation of over 100% is possible at times where a battery is charged and discharged more than once during a day.
- Low battery utilisation can be due to either insufficient PV generation to charge the battery (often the case in winter, or on cloudy days), or because loads are small overnight and the battery does not fully discharge. If you have low battery utilisation you may want to reduce the size of the batteries or recommend forced charging of the batteries on an overnight tariff to the property owner.