
Getting started with the Consumption task
The Consumption task projects financial savings by simulating solar generation against property consumption on a minute-by-minute basis over a full year to model energy flow between appliances, batteries, and the grid. With no limits on system size and options to use client's uploaded meter data, it's a fast and accurate way to estimate self-consumption and grid independence.
Configuring the Consumption task
When the Consumption Task opens, a menu will appear where you can configure the settings for calculating the system’s generation and consumption. Use the left-hand navigation to choose the settings you want to edit.
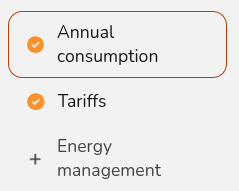
If you'd like to change these values at a later stage, click Edit in the top right or edit specific options directly from the right-hand sidebar.

Consumption inputs
Expand each section below for more details on each setting.
Annual consumption
In this section you are configuring how energy is consumed in the property across the year. This consists of the annual consumption figure (kWh) and how the consumption is distributed across the year (the consumption profile). You can select from the following options to set the annual consumption:

Annual usage
If you know the annual consumption in kWh (for example from an electricity bill) you can enter it here in the annual usage field.
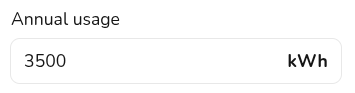
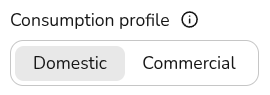
When you use this option you can choose from a variety of domestic and commercial consumption profiles, the consumption profile determines how the energy is used within a week and throughout the year.
Meter data
If the property has a smart meter you can upload half-hourly data to get a more accurate projection. The file must be in a particular format for Easy PV to use it:
- The data should ideally span at least a year (but if it contains a minimum of 6 months our algorithm will automatically attempt to fill in gaps where they are detected).
- The file must have a .csv file extension. If your data is in another file type you can export it as csv from Excel, Google Sheets, Libreoffice or any other spreadsheet editor.
- If you are getting an error when trying to upload the data, you can also download our sample spreadsheet here and change your data into this format.
Not sure
If you don't know the electricity consumption in the property and it's domestic, you can use typical values for the size of property provided here.

These options will assume a domestic consumption profile.
Tariffs
Here you should select the tariffs used in the Easy PV calculation. It is important to set suitable tariffs so the financial calculations for this project are accurate, particularly if you plan to configure forced charging or discharging of a battery. By default, we'll calculate the financial benefits using your default tariffs which you can specify in your financial settings.
You can select from the drop down you can create and select a new tariff by selecting + New import/export tariff.
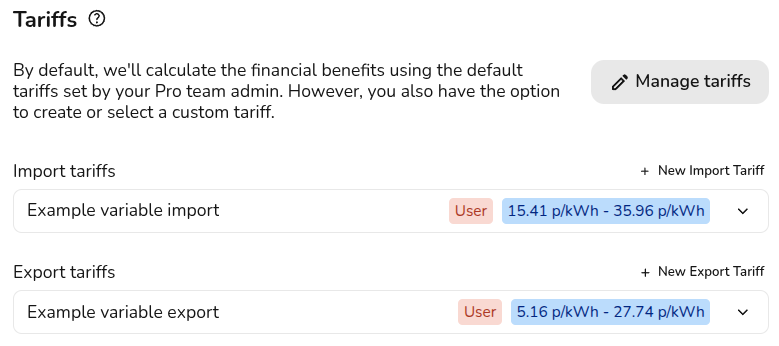
If the tariffs you've selected are different to the ones the customer is currently on, then you can select their current tariff for more accurate financial benefit calculations. This is used to calculate how much they will save on their current bills. The tariffs input above will be used for any future calculations.

Warning: This only sets the tariffs for the Easy PV self-consumption calculation. If you'd like to use the MCS method you will need to set your tariffs in the Financial task.
Learn more:
+ Energy management
In this section you can optionally model export limitation and forced charging and discharging of batteries. Read more about setting these up below.
Export limiting
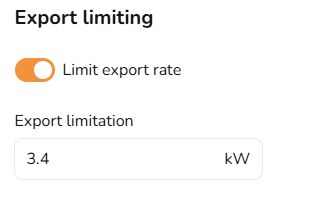
In this section you can limit the export rate if this is required by the DNO. Export limitation restricts the amount of solar power sent to the grid, preventing it from exceeding a set threshold. This is used to comply with grid regulations, prevent overloading, and encourage self-consumption. Any excess energy beyond the limit is curtailed.
Switch the toggle on and then input the annual export limit in kW.
Battery optimisation
Manual Timers - In this section you can set the periods where the battery will force charge and discharge to and from the grid. Switch on the toggle and then input the times and days you want the battery to charge and discharge.
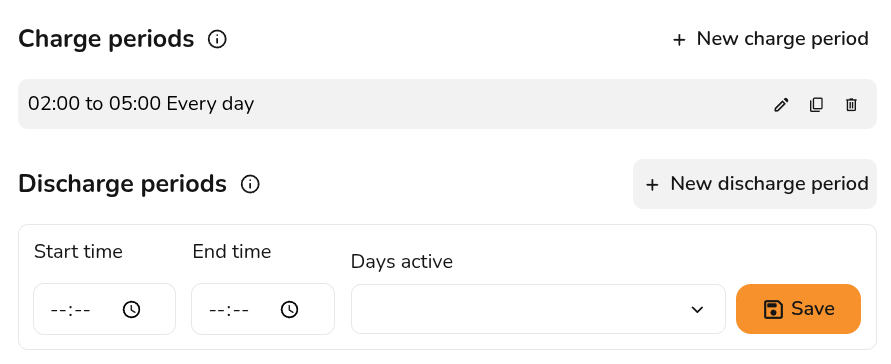
Warning: The discharge period is for discharging to the grid. Easy PV will still model when the battery will be charged and discharged based on solar production and consumption. These charge and discharge periods are to override the Easy PV model.
Smug Optimisation - If you have Smug optimisation toggled ON in your settings, a Smug-compatible inverter selected and a variable tariff, you can select 'Smug Optimisation'.
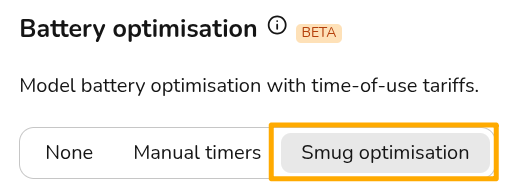
The Smug battery optimisation app uses weather forecasts, machine learning and historical consumption patterns to automatically charge and discharge batteries to increase savings and maximise income from exported energy. This will show you the percentage improvement and cost benefit of the configured optimisation.
Learn more:
When you have finished configuring these inputs, click Done on the Energy Management tab.
Navigating the Consumption task
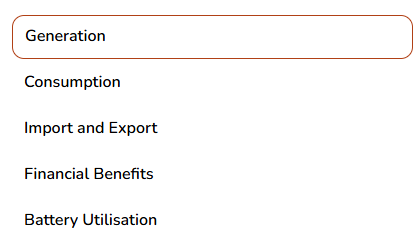
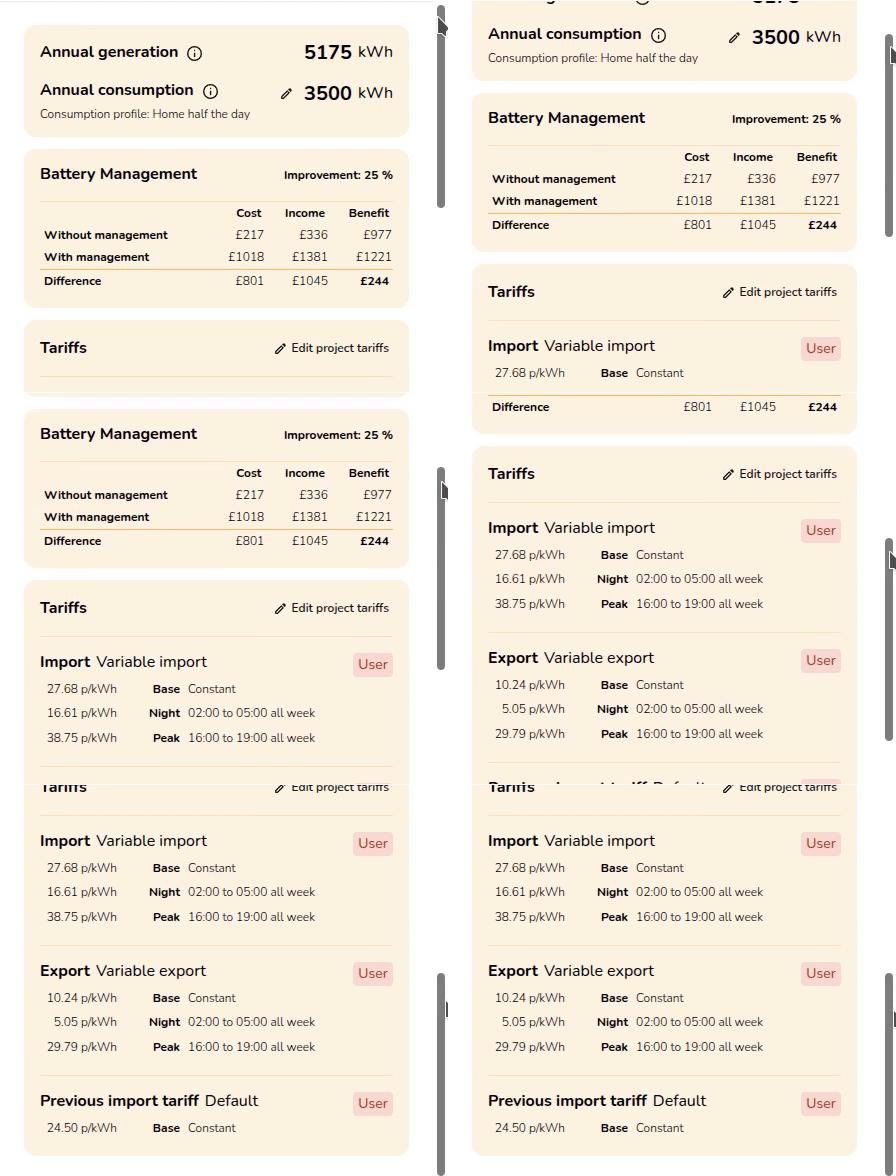
Once the task has been configured, you'll be able to view the full insights. The right-hand sidebar on the page includes options to help you navigate through the different sections of insights.
Below on the right-hand side you will see the following:
- Annual Generation: This pulls through from the Performance task.
- Annual Consumption: This is based on your input when opening the task. Click the pencil open the Annual consumption tab directly.
- Battery Management: If showing battery optimisation, this will show you the percentage improvement and cost benefit of the configured optimisation. If you have Smug selected this will be taken into account in this statistic. If you have manual optimisation selected, ensure that you have the correct tariffs and charging periods configured.
- Tariffs: This shows the tariffs you have selected on the project. Click
Edit project tariffsto open the Tariffs tab directly.
In the top right corner, you'll have the following options:
Update the annual consumption, tariffs and energy management settings Download data
Download generation and consumption profiles to import into other software Help page
Open this page directly
Understanding Consumption task data
Once you have configured the Consumption task inputs and submitted them, you can explore the calculated information.
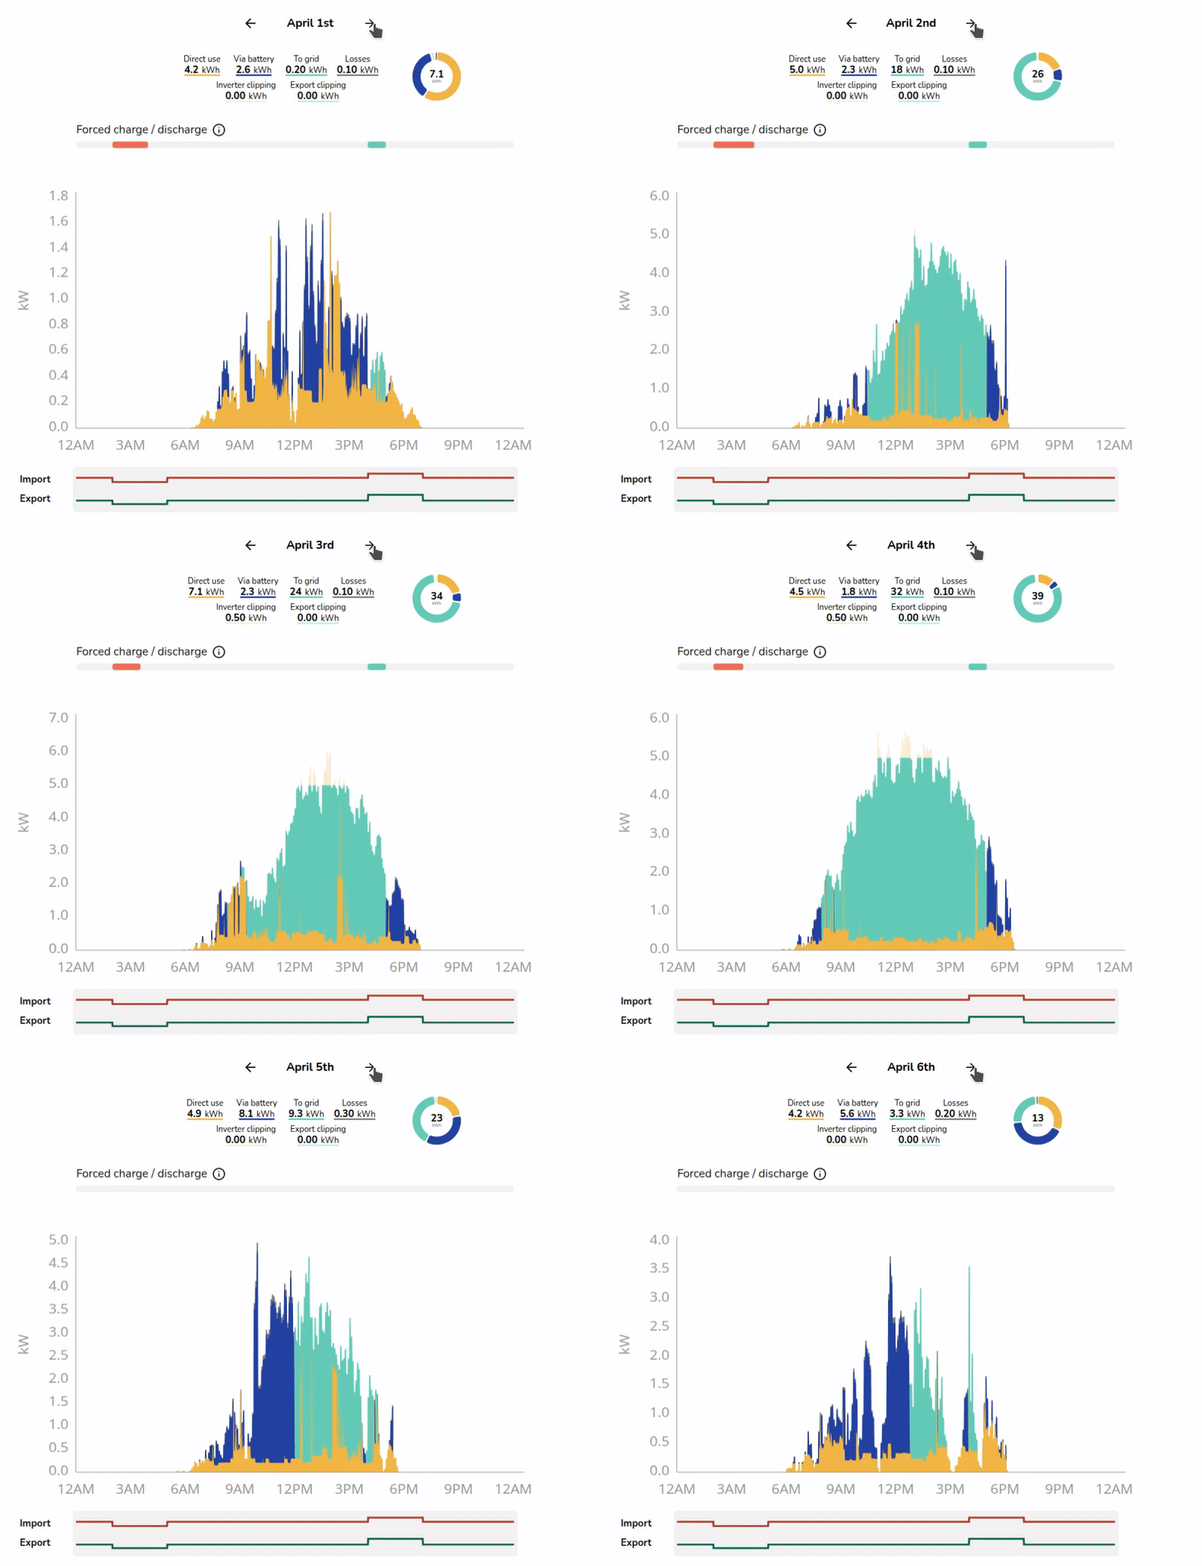
The left-hand side shows the full results of the Consumption task calculations with interactive graphs and detailed insights. For each section, the top graph gives you the annual figures in kWh and the bottom graph gives daily figures in kW.
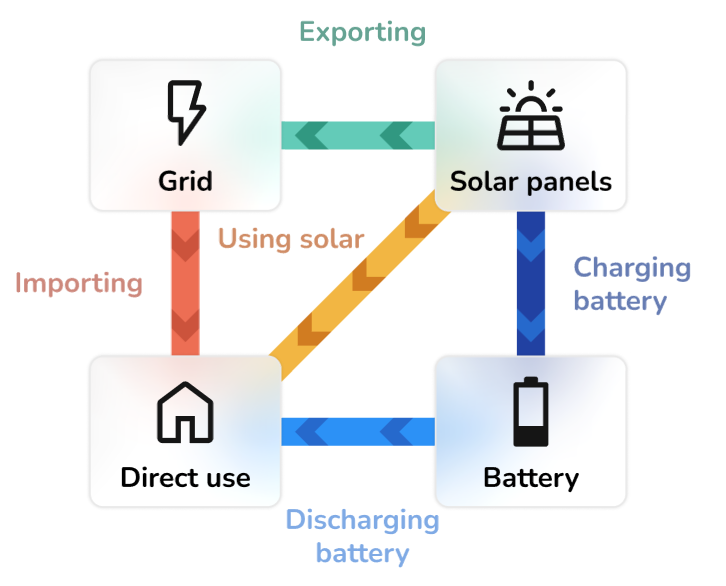
All graphs use the following key to help you understand the generated data:
Generation
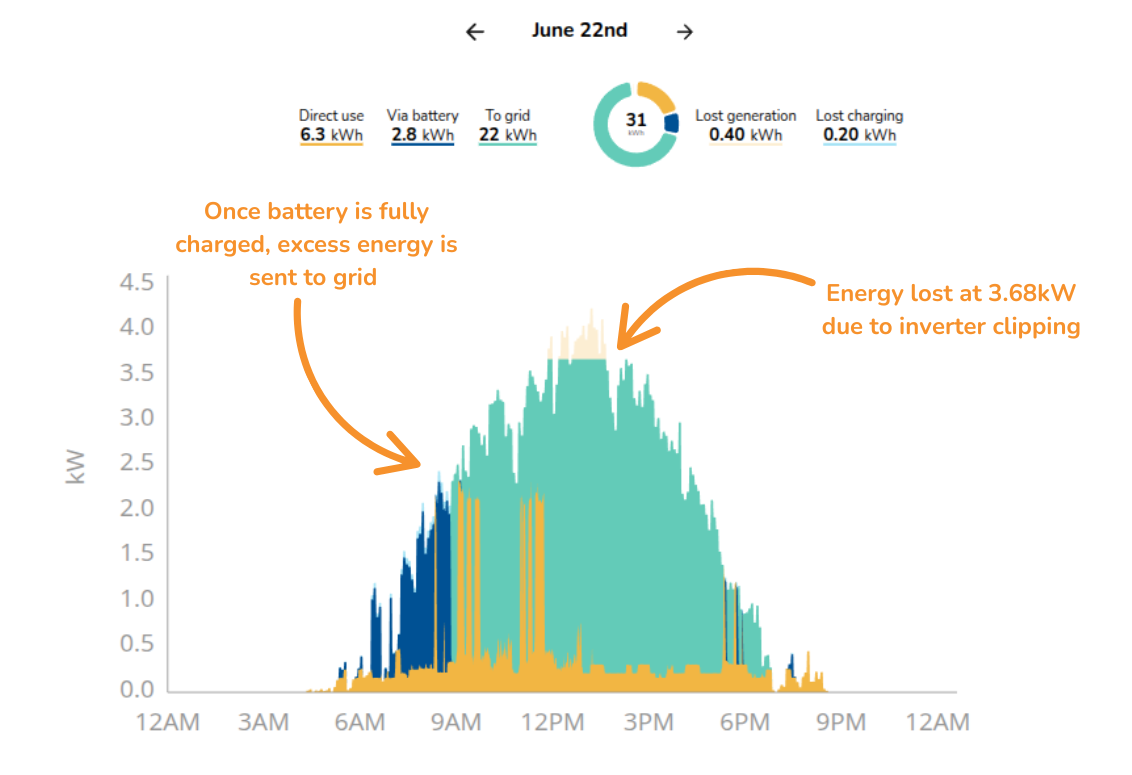
- This shows the estimated annual generation of the system and whether the generated energy is used directly in the house, used to charge the battery or exported to the grid.
- It will also display the amount of energy lost through inverter clipping, export clipping and charging if applicable.
- Bottom graph can help understand export rates and the impact of export or inverter clipping, with figures given in kW.
Consumption
- This shows the total annual energy consumption of the property across the year based on the selected consumption profile.
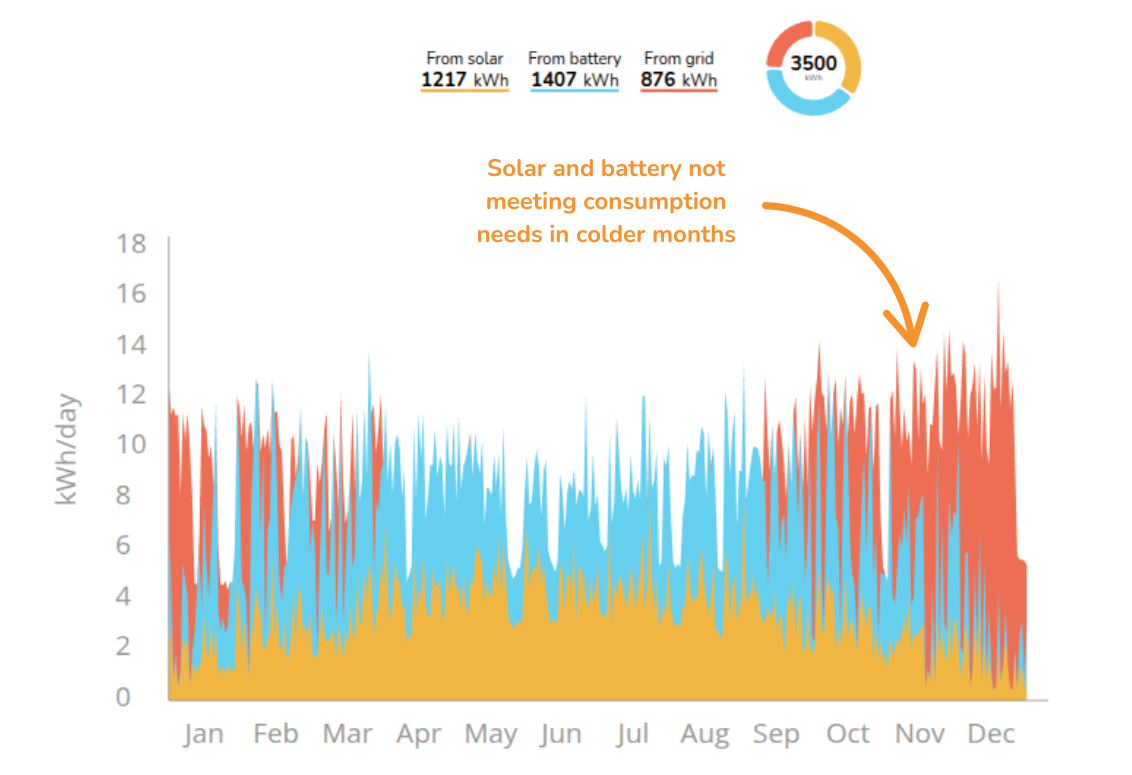
- It shows how much energy is expected to be supplied directly from the solar array, via the battery or imported from the grid.
- Top graph useful to see how consumption is distributed across the year and how this consumption is being met.
Import and export
- This shows the likely flow of energy to and from the grid over the course of a year.
- It's likely that there will be more energy exported during summer when the solar array is generating more energy, and more energy will be imported from the grid during winter months.
Financial benefits
- This shows the money spent and earned on electricity flowing to and from the grid over the course of a year based on selected tariffs.
- It allows you to see the total money earned from export payments versus the money spent on imports, and how it would compare to having no solar installed.
Warning: If you would like to use the Easy PV self-consumption calculations as the basis for your financial projections in the customer proposal, make sure it is selected in the Financial task.
Battery utilisation
- This helps you understand the modelled utilisation of the battery over the course of the year based on the amount of the the available battery capacity that is actually charged and discharged each day.
- Utilisation of over 100% is possible at times where a battery is charged and discharged more than once during a day.
Note: If you have low battery utilisation you may want to reduce the size of the batteries or model forced charging of the batteries on an overnight tariff.
Consumption task: FAQs
❓ How does the Consumption task estimate self-consumption?
Easy PV simulates generation, consumption and battery usage across a full year to estimate how much solar energy is used on site. The self-consumption is the proportion of electricity generated that is consumed on the property (directly or via a battery).
To determine how much is used in the property, we use the total generation figure from the Performance task and model this across the year using a PVGIS generation profile. This is then compared against the chosen consumption profile. Easy PV looks minute-by-minute over the course of the year at how much energy is generated and consumed and, if present, how charged the battery is. It then models how the energy would be diverted accordingly. For example, if solar power is being generated and the profile shows they are consuming energy at that time, then this energy will be diverted to consumption. If they are not consuming at that time then it will be used to charge a battery (where present) or discharged to the grid. This factors in forced charge and discharge times, battery specs and export limits. We can then determine how much is used directly, used to charge the battery or sent to the grid.
❓ What is the difference between the MCS and Easy PV self-consumption calculations?
There are a few differences between the Easy PV and MCS self-consumption calculations:
| easy-pv.co.uk MCS | Easy PV | |
| Easy PV task |
Completed at the end of Performance task, select |
Completed in Consumption task, select |
| System size and consumption |
Strict limits:
|
No limits on system size or consumption. Any consumption, generation or battery capacity |
| Consumption profile | Domestic profiles only: home all day, home half the day and out all day |
Domestic or commercial consumption profiles. Plus the option to upload half-hourly data from customer |
| Method | Determines self-consumption based on look-up tables specified in MGD 003, using annual generation and consumption totals | Models how generation is distributed using PVGIS data, then calculates usage minute-by-minute across the entire year. |
| Additional options | Limited since it only compares annual figures and cannot factor in real-time changes. | Minute-by-minute calculation means export limits, inverter clipping, variable tariffs and forced charging/discharging of batteries are factored into calculations |
❓ Why are my tariffs not pulling through to the proposal?
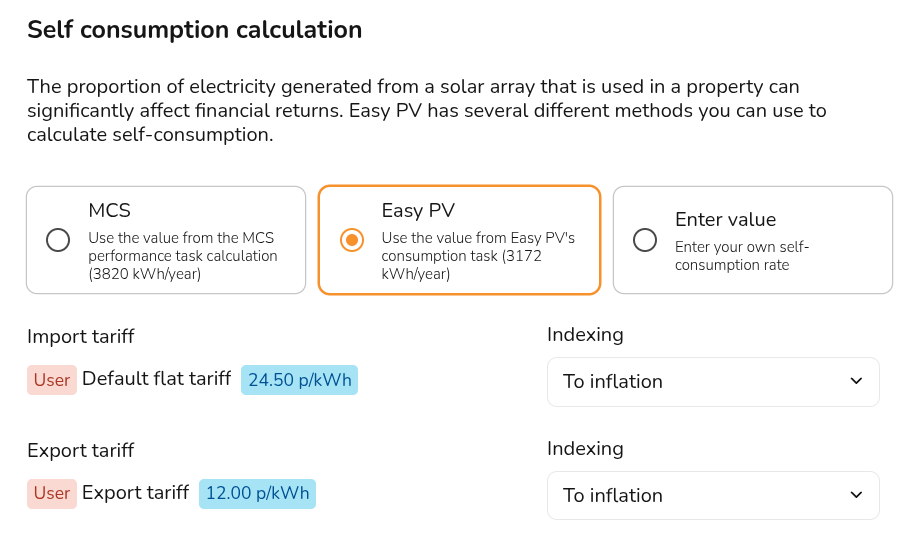
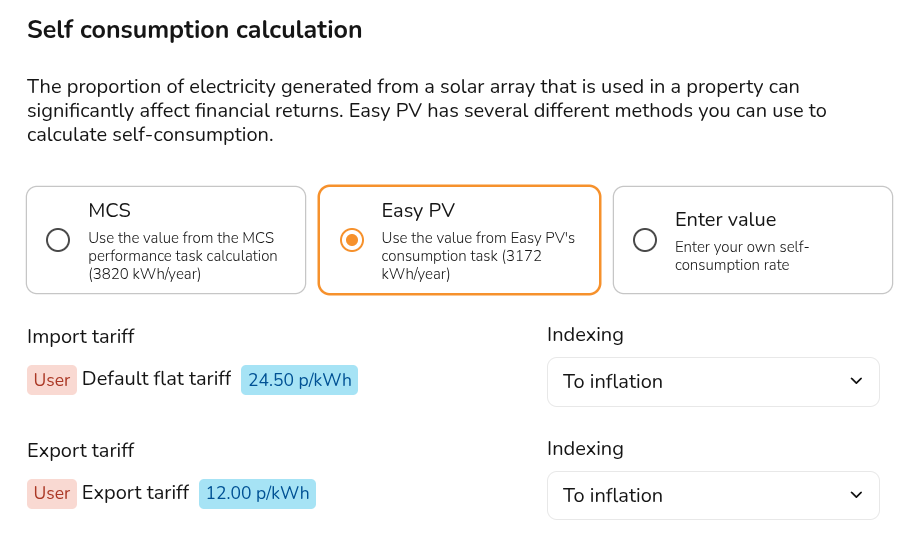
If the tariffs in the proposal do not match the ones you've set up, it's likely you're using the wrong self-consumption method, as these use separate tariffs.
To fix this, follow these steps:
- Navigate to the Financial task
- Select Financial inputs in the top right
- Under self-consumption, you can see the method selected and which tariffs are being used. Make sure you have both the right tariffs and method selected there:
- Save and exit
Still Need Help?
Contact Support: If you've got further questions, get in touch with our support team at help@easy-pv.co.uk (UK) or help@easy-pv.ie (IE). If you are experiencing a bug, to help us look into your issue faster, please include the email address of your account, the name of the project and screenshots of any unexpected behaviour.