Performance and self-consumption
Performance task
This guide applies to easy-pv.ie and easy-pv.co.uk versions of Easy PV. The information provided here may not be accurate for easy-pv.com.
The performance task uses the system data, location and shading information to estimate the annual output of the system. This is then used in self-consumption calculations to estimate how much of what is generated will be used directly, used to charge a battery or exported to the grid, which is needed to estimate the financial benefits of the system.
Getting started with the Performance task
You can access the Performance task via the 'Tasks' drop-down menu or from the task list to the left on the project overview page.
When the Performance task first opens, you'll be shown a popup that lets you configure the settings you want to use. You can use the left hand navigation to choose the settings you want to edit. More information on each of the settings is available below.
When you have finished configuring these inputs, click Done.
Navigating the performance task
The right hand sidebar contains options to switch between the Sunpaths and the Performance results:

As well as the following:
|
|
Edit inputs Click to update the location, pitch and orientation of the roofs and panel allocation |
 |
Open help page Go directly to this help page if you're ever having trouble. |
|
|
Go to user preferences Adjust which performance dataset is used, sunpath and panel allocation automation, and MCS self-consumption defaults. |
|
|
Open performance report See MCS performance table with sections A, B, C and D (if MCS self consumption completed and selected in financial task). |


View and edit Sunpaths
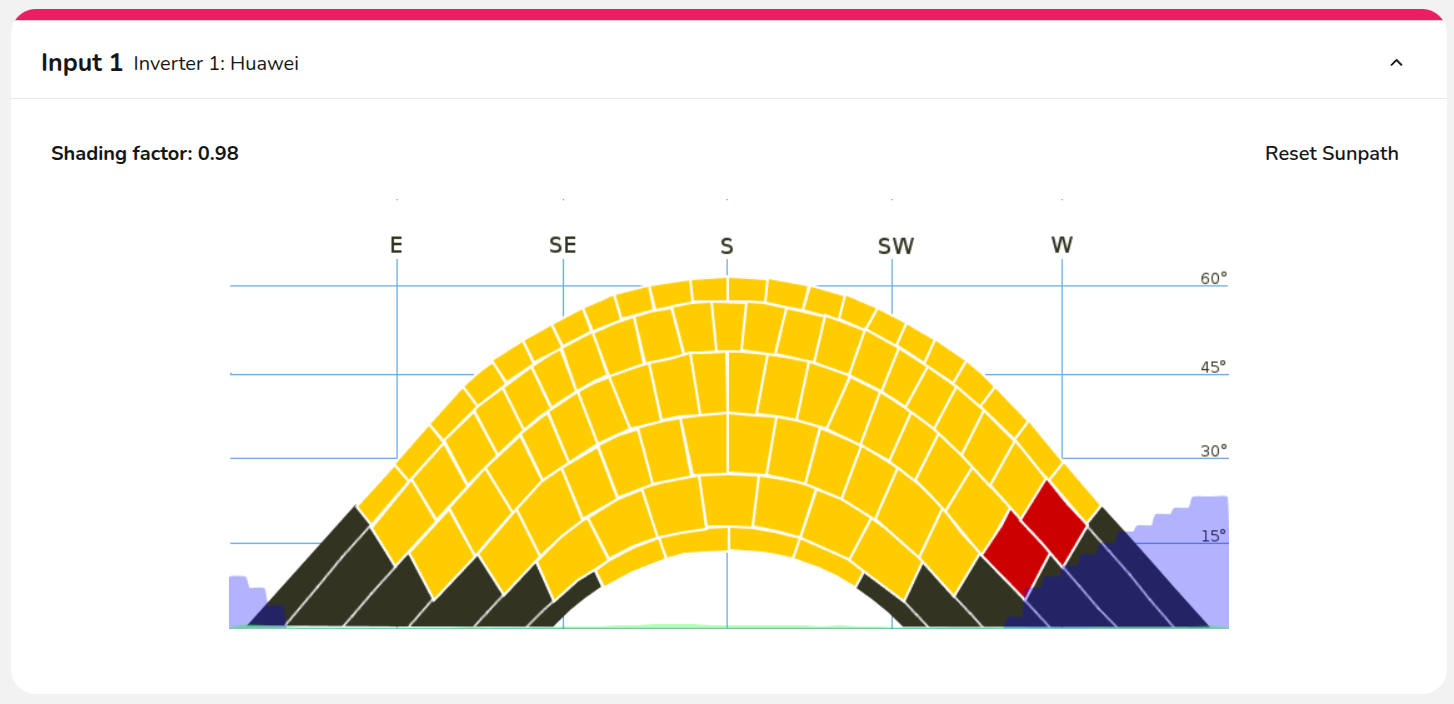
The sunpath diagrams maps the path of the sun across the sky at different hours in the day for different months of the year. For each point on the sunpath diagram, Easy PV calculates the amount of solar radiation reaching the panels from direct and diffuse radiation. For shaded regions, where direct radiation is radiation is fully blocked, the system calculates how much diffuse radiation still reaches the panels. The shading factor is the proportion of solar radiation that reaches the panels after accounting for these shading losses.
Automating with 3D
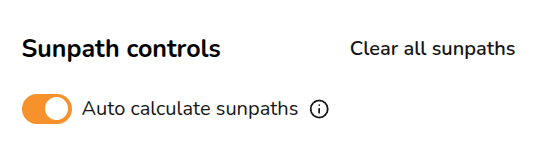
If designing in 3D or magic design mode, the shading can be calculated automatically, provided any trees or obstructions have been modelled. If you would like to manually edit the sunpaths then toggle off 'Auto calculate sunpaths'.
If designing in 2D, you will need to manually draw on the sunpath diagram what shade is on the panels at different points in the year. Click between the inputs to expand the sunpath diagrams for each inverter.
Read here about the differences between design modes.
Navigating between inverters and inputs
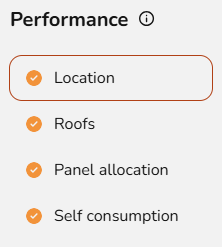
On the right you will see each of your inverters, when selecting between them you will see each input or shading group for that inverter on the left. Once each sunpath diagram has been calculated, a green tick will show on the inverter.
View the Performance results
These results will depend on which version of Easy PV you are using, below you can expand for information on each version:
MCS performance and self-consumption results
The performance estimate calculated here is based on the method detailed in Appendix B of MIS 3002: The Solar PV Standard (Installation). See the end of this section for more information on the methodology used for the self-consumption calculation.
The MCS performance report can be accessed from the forms (and then reports) drop down menu.
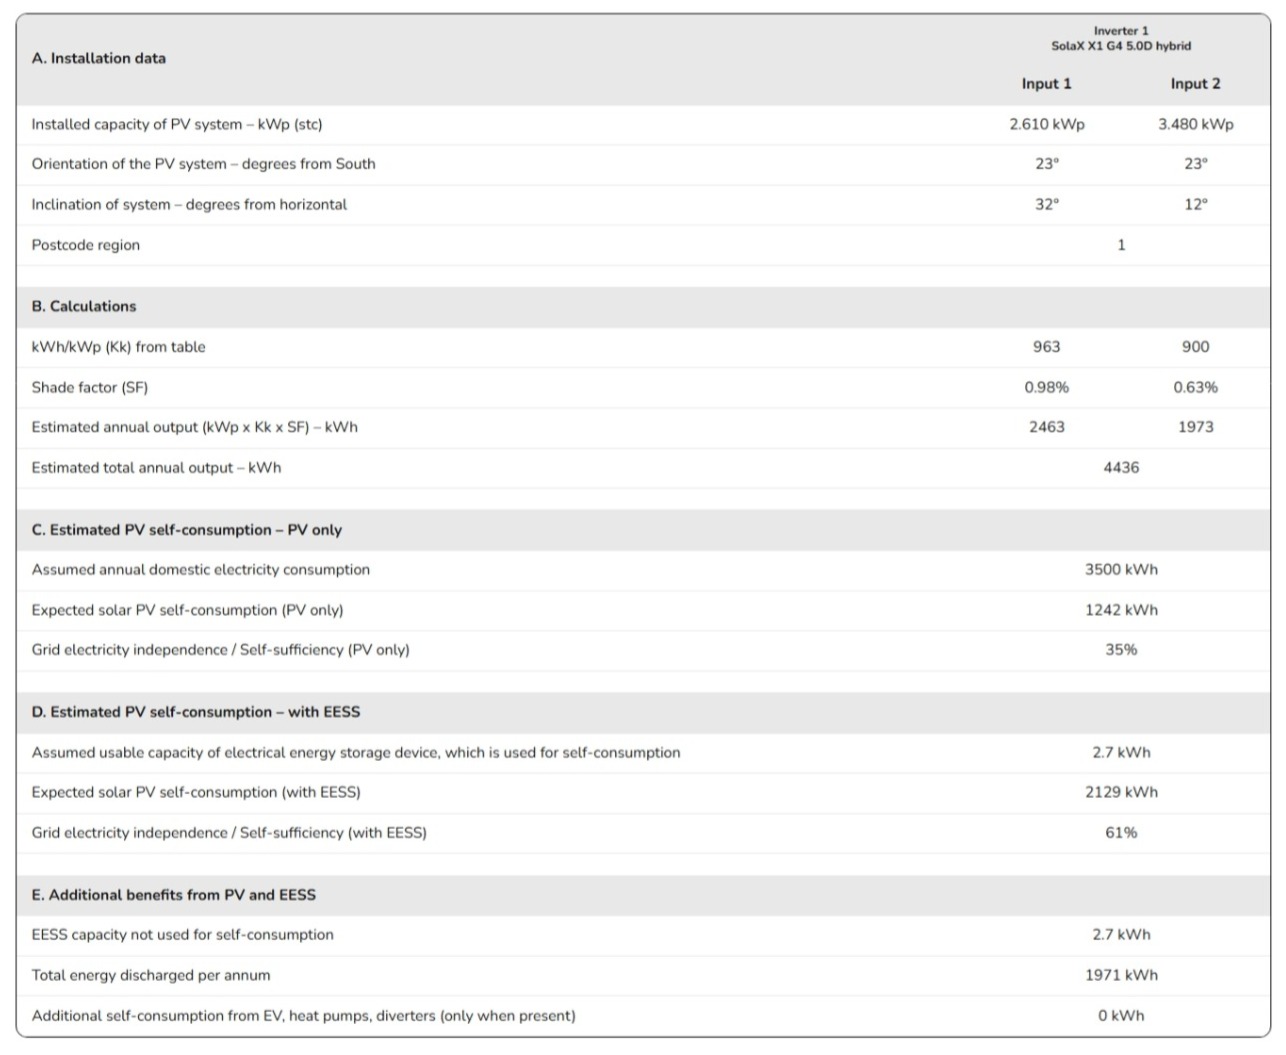
A. Installation data
This section details the installed capacity, orientation of the system, inclination of the system and the location. These inputs can be adjusted by clicking the pen icon in the top right or by adjusting the panels on the system.
B. Calculations
Using the installation data and the shading factor, an estimated annual output is calculated. To adjust the shading factor, navigate to the sunpaths diagrams tab.
C. Estimated PV self-consumption – PV only
The estimated self-consumption for the system with PV only is taken from the MCS lookup tables, depending on the values above and those input in the task. Click the pen icon to adjust these inputs.
D. Estimated PV self-consumption – with EESS
The estimated self-consumption for the system with PV and battery storage is taken from the MCS lookup tables. This section will not show if there is no battery storage, navigate to the inverter task to include battery storage.
E. Additional benefits from PV and EESS
If additional consumption is anticipated or some of the battery capacity is reserved for ancillary services, that will be detailed here. This section will not show if that is not the case, to edit those inputs click the pen icon in the top right and navigate to the self-consumption tab.
NREL performance results
Section A details the installed capacity, orientation of the system, inclination of the system and the location. These inputs can be adjusted by clicking the pen icon in the top right.
In section B, the data in section A is used to estimate the output per kWp for the unshaded array using the NREL's PVWatts calculator. The percentage of output lost from shade is then subtracted from this value. This is then multiplied by the kWp of the input to calculate the estimated generation per input. To adjust the percentage lost, navigate to the sunpaths tab.
Edit the Performance task inputs
Certain inputs are required for the performance estimate to be calculated. Designing in 3D and configuring your settings to automate panel allocation and sunpath diagram calculations will streamline much of this task.
Location
If not already input when creating the project, you will need to set the location. This is necessary for performance calculations since where in the world the system is located determines how much sunlight it will get. If there is no postcode for the location of your system, choose the most local one you can find.
This section may show as ticked and completed already if this information can be pulled from the start of the project.
Roofs
If you are creating a flat roof system or using quick roof mode, you will also need to input pitch and orientation. Both this and the location data are used to determine the output of the system.
This section may show as ticked and completed already if the pitch and orientation can be populated from earlier in the project.
Panel allocation
This section will depend on how you have configured your settings.
- If you have selected for your panels to be automatically allocated, then panel allocation will show as completed
- If you have selected suggest allocation then here you can choose to edit the allocation or select Done to accept the allocation and close the window.
- If you have manual allocation selected then you will need to allocate the panels here.
There are some cases where auto-stringing will not work and manual allocation will be required. Further information about manual panel allocation can be found here.
Self-consumption calculation
A self-consumption model is available through the Consumption Task. For UK users, this can be provided to customers in addition to the MCS calculation, which is completed here in the performance task.
MCS self-consumption calculation
This process follows MCS guidelines defined in The Battery Standard MIS 3012 ISSUE 0.1 to predict self-consumption of the generated PV electricity. UK companies installing under MCS will need to provide this calculation when it can be used.
Annual electricity consumption of the property
The lookup tables for this calculation only permit values between 1500kWh and 6000kWh. Use the consumption task for more detailed consumption calculations or for values that fall outside this range.
For the most accurate results use a value from past electricity bills. Where possible, consumption data should be taken before the installation of electric heating / hot water or electric vehicle charging.
Occupancy archetype
Properties that are occupied during the day will typically consume more PV-generated electricity directly. Properties that are empty during the day may benefit more from battery storage that can store PV-generated electricity for later use.
Proportion of battery used for ancillary services such as backup power or arbitrage
If there is a battery on the project, this question will appear. If the entire battery capacity to be used to increase self-consumption, this value will be 0%.
The lookup tables for this calculation only permit that the usable capacity is less than 15.1kWh, in this case use the consumption task for more detailed consumption calculations.
Is additional self-consumption anticipated?
The MCS calculation does not account for consumption arising from "non-typical domestic loads" such as electric space heating, swimming pools, heat pumps, electricity power diverters, electric water heating and electric vehicles.
You can enter any figure here, but the calculation assumes that a maximum of 95% of the generated electricity is available for self-consumption so the value in the results table will be capped to the remaining available generation capacity.
Manual panel allocation
Manually allocating panels is slightly different depending on whether the panels are optimised or not. All panels connected to an input must be within a certain pitch and orientation threshold and panels incompatible with the selected string will be un-selectable. In this case the panels may need to be optimised.
Without optimisers
- Select inverter input and the roof you'd like to allocate from the lists on the left.
- Click or drag over panels to allocate them to an inverter input.
- Go to the next inverter input and repeat.
- Once all inverter inputs have the correct number of panels, all inputs will be in green and a tick will show at the top. Below all your inverters and roofs, you can then click next to continue with the performance task.
With optimised systems
You can add optimisers in the inverter task by clicking Add optimsers + to the top right of the inverter string. This will automatically add optimisers to all panels on that inverter, if you would like to remove some, this will have to be done manually in the financial task.
When you come to allocating the panels the steps are largely similar to non-optimised systems:
- Select inverter input and the roof you'd like to allocate from the lists on the left.
- Use the Add group + option to sub-divide the input into shading groups and then select the roof you want to allocate panels to. You should group panels that will get similar levels of shade and Easy PV will require that you use shading groups for panels that are on different facing roofs but on the same string.
- Click or drag over panels to allocate them to an inverter input or shading group.
- Go to the next inverter input or shading group and repeat.
- Once all inverter inputs have the correct number of panels, all inputs will be in green and a tick will show at the top. Below all your inverters and roofs, you can then click next to continue with the performance task.
Adding optimisers in the inverter task will not automatically change the generation.
The generation is a product of the kWp of the inverter, the kk value (which is based on the pitch, orientation and location of the panels) and the shading factor. Putting panels in separate shading groups in Easy PV allows Easy PV to factor in differences in the kk value and shading factor for the panels in each group on a single string. Without shading groups the generation will not change because the kk value and shading factor will be the same on the whole string, as it would be without optimsers.
Other options
-
Use the
 icon to reset the allocation on the inverter or individual inverter inputs.
 - Below where it says Next, you also have the option to use auto-stringing. This will not work for systems that require shading groups.
Consumption task
This guide applies to easy-pv.co.uk. The information provided here may not be accurate for easy-pv.ie.
The consumption task is an alternative to the MCS self-consumption calculation completed in the performance task. Unlike the MCS self-consumption calculation, the Easy PV calculation can be used for projects larger than 6000 kWh and with batteries over 15.1 kW.
Table of contents
Getting started with the Consumption task
You can access the consumption task via the 'Tasks' drop-down menu or from the task list to the left on the project overview page.
When the Consumption Task opens, a popup will appear. Here, you can configure the settings for calculating the system’s generation and consumption. This will open on the 'Annual consumption' and then you can use the left-hand navigation to choose the settings you want to edit.
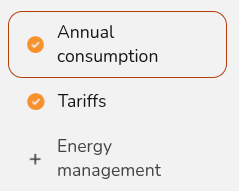
More information on each of the settings is available below. When you have finished configuring these inputs, click Done on the Energy Management tab.
Navigating the Consumption task
In the top right corner, you will see the following options
|
|
Edit inputs
Update the annual consumption, tariffs and energy management settings used for the calculations. |
 |
Download data
Download your generation and consumption profiles as a .csv file to import into other software. |
 |
Help page
Open this page directly. |

The right-hand sidebar on the page includes options to help you navigate through the different sections of insights. Read below for more information on these insights.
Below that you will see the following:
- Annual generation: This pulls through from the performance task.
- Annual consumption: This is based on your input when opening the task. Click the pencil to edit.
- Optimisation benefits: If showing battery optimisation, this will show you the percentage improvement and cost benefit of the configured optimisation. If you are not seeing the expected benefits, make sure you have the right tariffs and charging periods configured.
- Tariffs: This shows the tariffs you have selected on the project. If you've selected that the customer is changing their tariff, their previous tariff will display here as well.
Understanding consumption data
Once you have configured the Consumption task inputs and submitted them, you can explore the calculated information.
The left-hand side shows the full results of the consumption task calculations with interactive graphs and detailed insights. For each section, the top graph gives you the annual figures and the lower graph gives daily figures.
Expand the sections below for more information on each section.
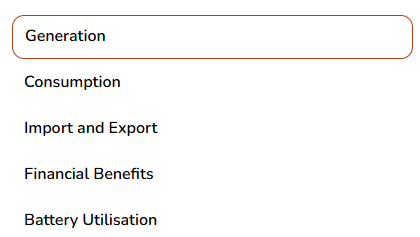
Generation
- This shows the estimated annual generation of the system and whether the generated energy is used directly in the house, used to charge the battery or exported to the grid. It will also show inverter and export limitation clipping if you've turned this on.
- Navigate between the dates in the lower graph to see daily insights.
Consumption
- This shows the total annual energy consumption of the property and where this energy will come from.
- It shows how much energy is expected to be supplied directly from the solar array, via the battery or imported from the grid.
Import and export
- This shows the likely flow of energy to and from the grid over the course of a year.
- It's likely that there will be more energy exported during summer when the solar array is generating more energy, and more energy will be imported from the grid during winter months.
Financial benefits
- This shows the money spent and earned on electricity flowing to and from the grid over the course of a year based on selected tariffs.
- It allows you to see the total money earned from export payments versus the money spent on imports, and how would compare to having no solar installed.
Battery utilisation
- This helps you understand the modelled utilisation of the battery over the course of the year based on the amount of the the available battery capacity that is actually charged and discharged each day.
- Utilisation of over 100% is possible at times where a battery is charged and discharged more than once during a day.
- Low battery utilisation can be due to either insufficient PV generation to charge the battery (often the case in winter, or on cloudy days), or because loads are small overnight and the battery does not fully discharge. If you have low battery utilisation you may want to reduce the size of the batteries or recommend forced charging of the batteries on an overnight tariff to the property owner.
If you would like to use the Easy PV self-consumption calculations as the basis for your financial projections in the customer proposal, make sure it is selected in the financial task.
Editing Consumption task inputs
When you first open the consumption task you will see the option to edit these inputs. If you'd like to change these inputs at a later stage, click the Edit option in the top right.
1. Annual consumption
You can select from the following options to set the annual consumption:

Expand the sections below for more details on these options.
Annual usage
If you know the annual consumption in kWh (for example from an electricity bill) you can enter it here in the annual usage field.
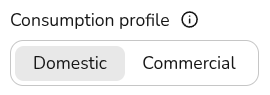
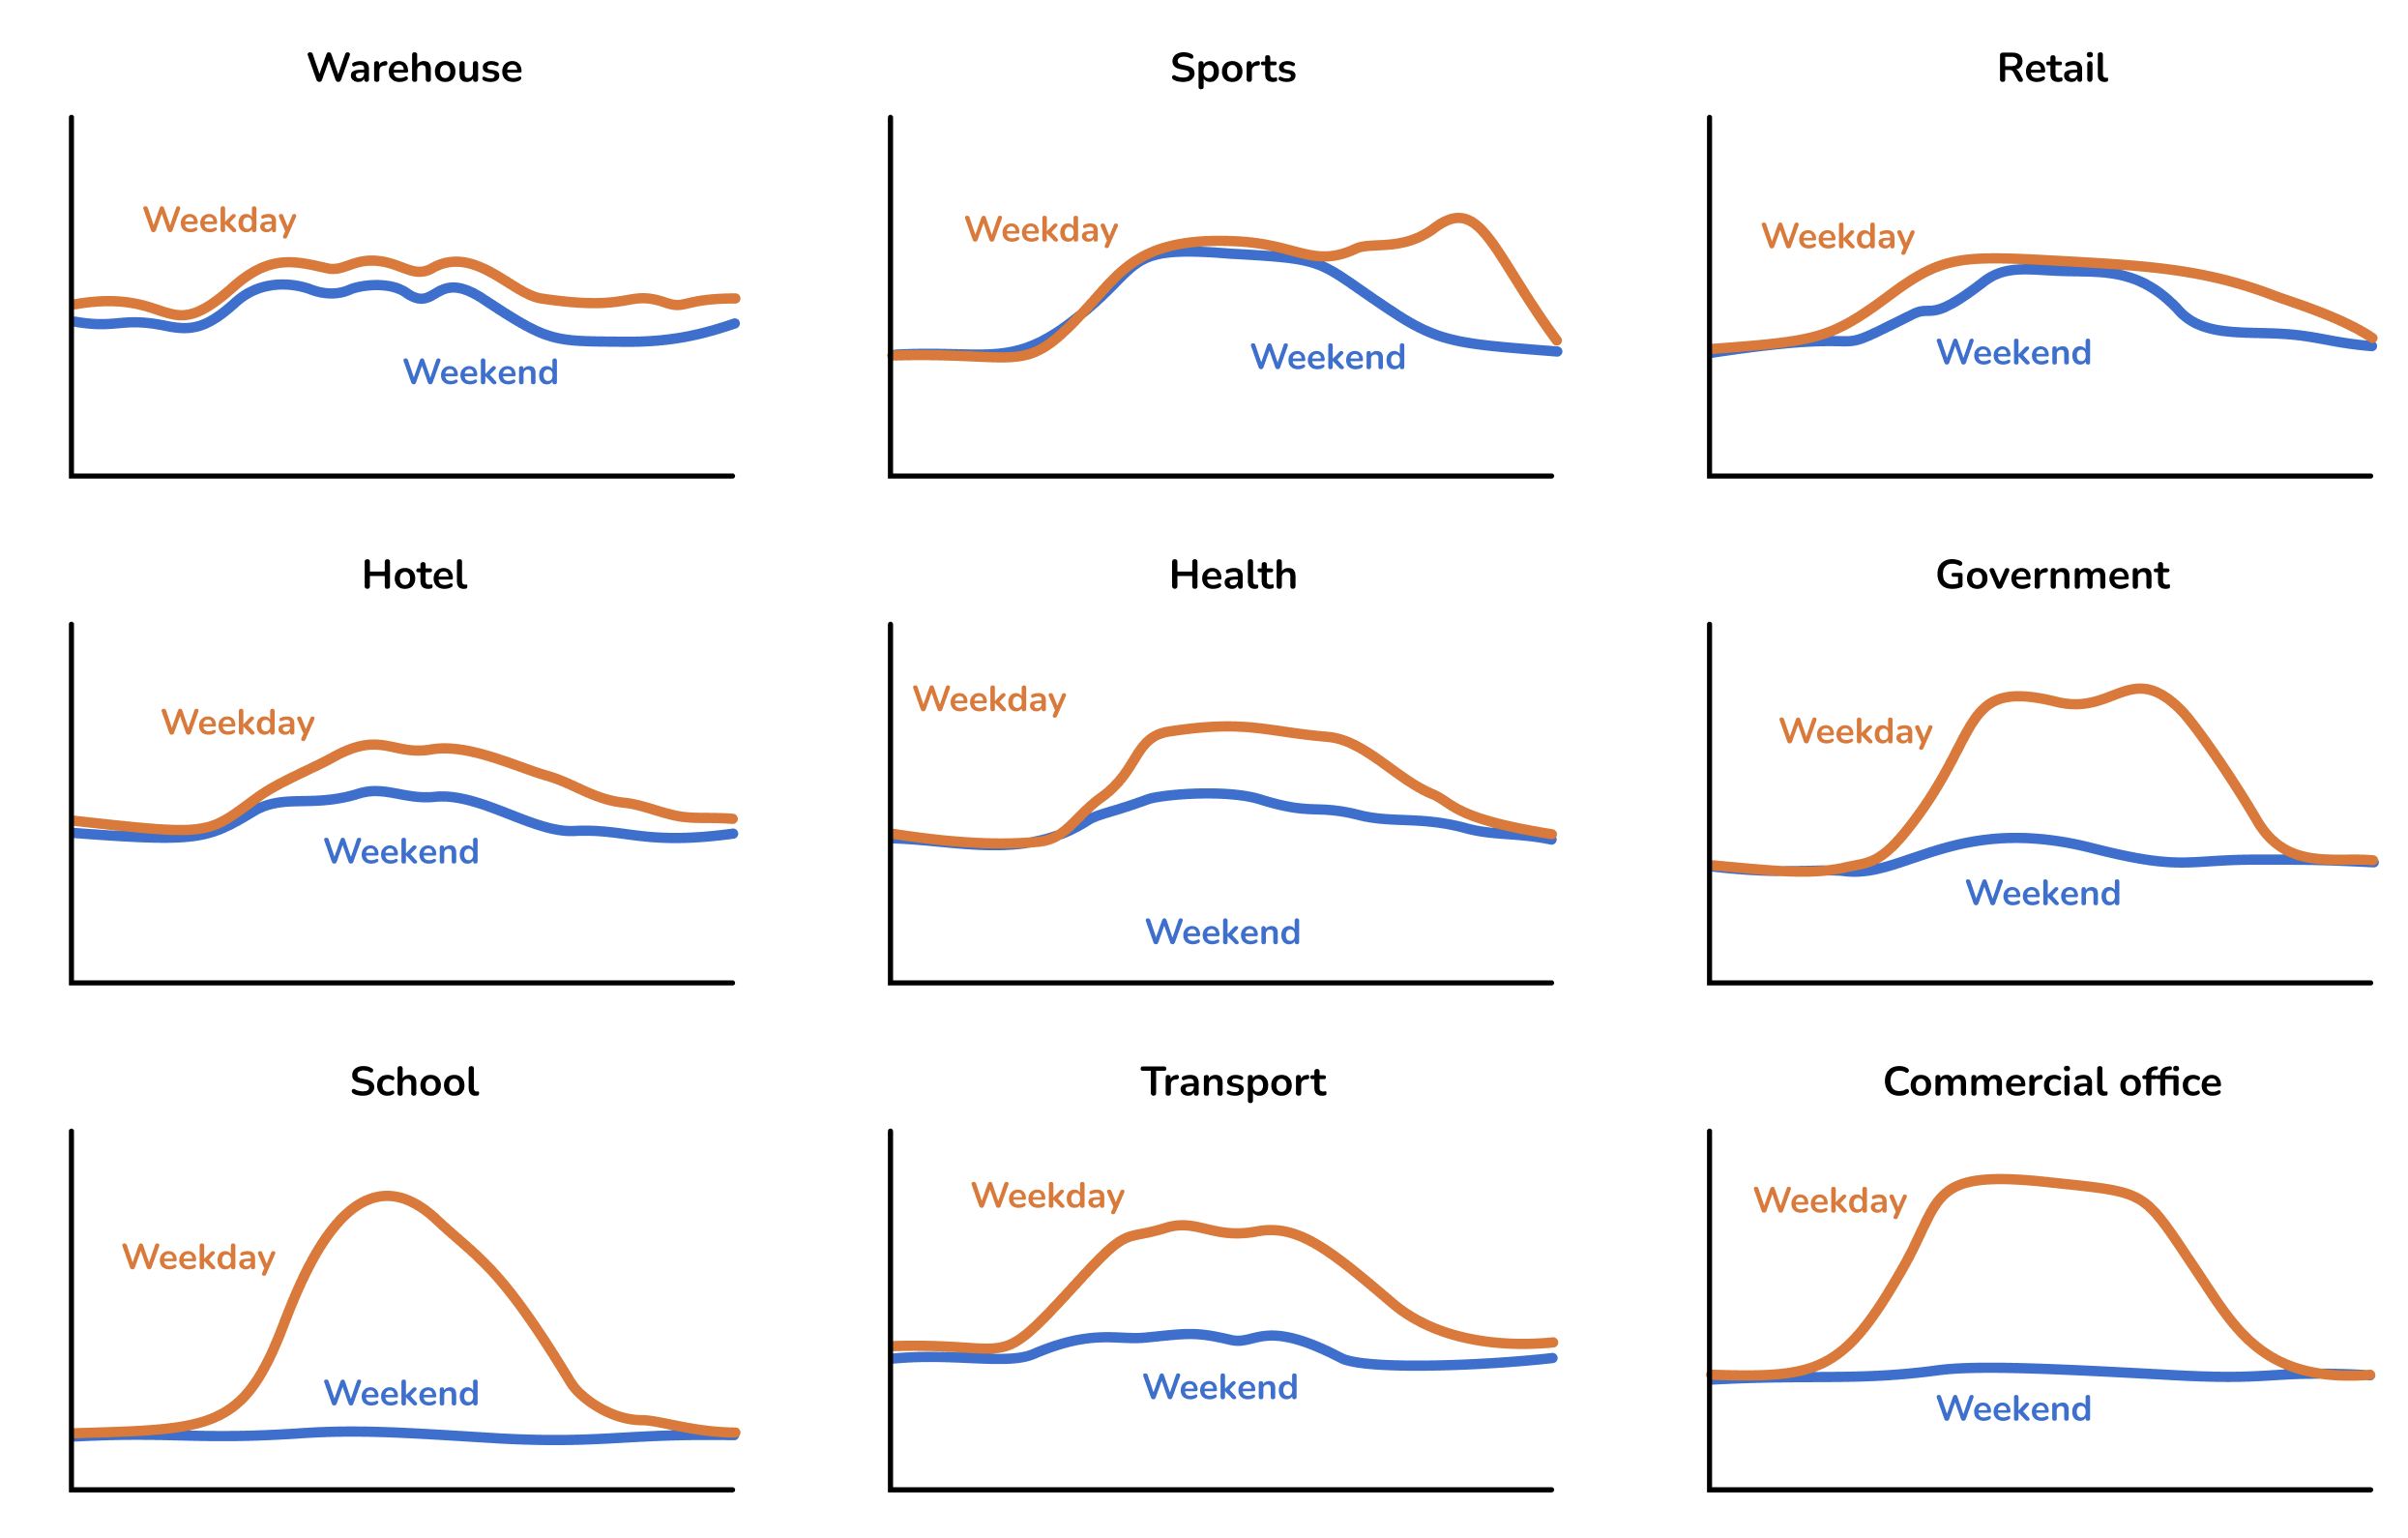
When you use this option you can choose from a variety of domestic and commercial consumption profiles, the consumption profile determines how the energy is used within a week and throughout the year.
The following commercial profiles are available
Meter data
If the property has a smart meter you can upload half-hourly data to get a more accurate projections. The data should ideally span at least a year (but if it contains a minimum of 6 months our algorithm will automatically attempt to fill in gaps where they are detected).
The file must have a .csv file extension. If your data is in another format you can export it as csv from Excel, Google Sheets, Libreoffice or any other spreadsheet editor.
Note that there are many different CSV formats for smart meter data, and we don't support all of them yet. If your upload doesn't work, please send us the spreadsheet at help@easy-pv.co.uk or help@easy-pv.ie and we will see if we can add the format. You can also download our sample spreadsheet here and change your data into this format.
Not sure
If you don't know the electricity consumption in the property and it's domestic, you can use a typical values for the size of property provided here.
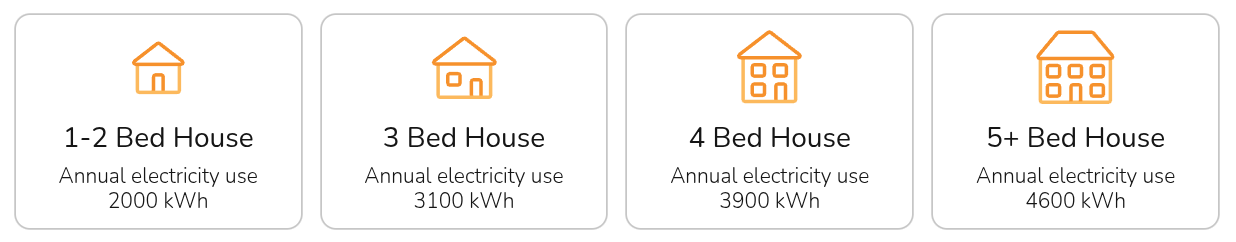
These options will assume a domestic consumption profile.
2. Setting the import and export tariffs
Here you should select the tariffs used in the Easy PV calculation. It is important to set suitable tariffs so the financial calculations for this project are accurate. By default, we'll calculate the financial benefits using your default flat tariffs which you can specify in your financial settings.
You can select from the drop down you can create and select a new tariff by selecting + New import/export tariff. See here for a full guide on creating tariffs in Easy PV.
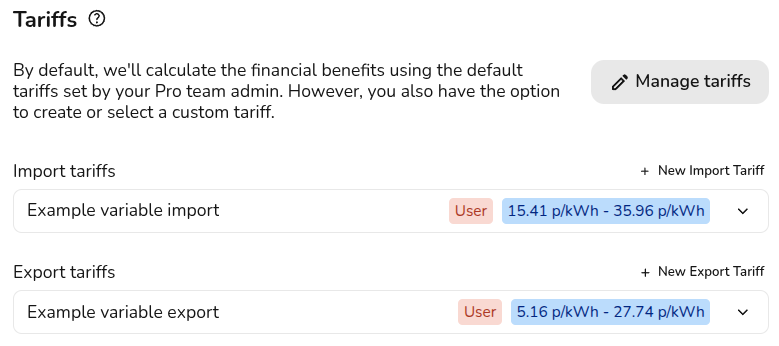
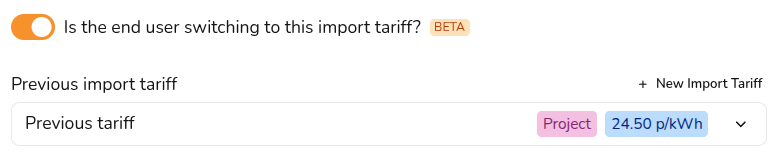
If the tariffs you've selected are different to the ones the customer is currently be on, then you can select their current tariff for more accurate financial benefit calculations. This is used to calculate how much they will save on their current bills. The tariffs input above will be used for any future calculations.
This only sets the tariffs for the Easy PV self-consumption calculation, if you'd like to use the MCS method you will need to set your tariffs in the financial task.
3. Energy management
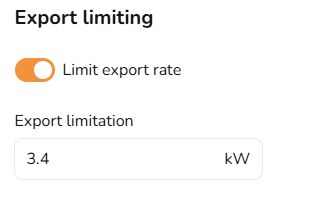
Export limitation
In this section you can limit the export rate if this is required by the DNO. Export limitation restricts the amount of solar power sent to the grid, preventing it from exceeding a set threshold. This is used to comply with grid regulations, prevent overloading, and encourage self-consumption. Any excess energy beyond the limit is curtailed
Switch the toggle on and then input the annual export limit in kW.
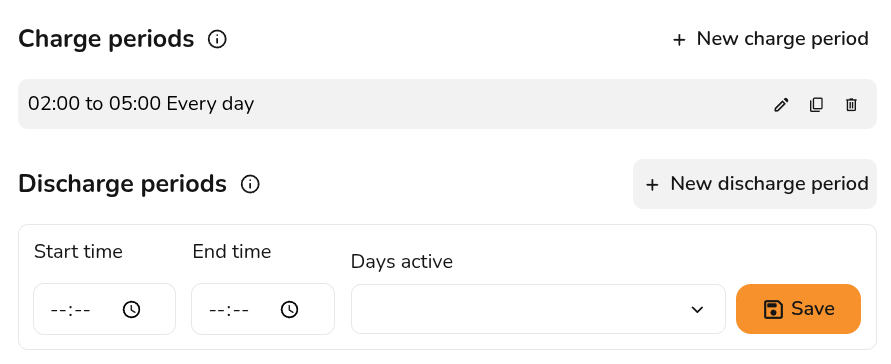
Forced charging and discharging
In this section you can set the periods where the battery will force charge and discharge. Switch on the toggle and then input the time times and days you want the battery to charge and discharge.
If you have any additional questions about the consumption task, please reach out at help@easy-pv.co.uk.
Editing and creating tariffs
This guide applies to the easy-pv.co.uk and easy-pv.ie versions of Easy PV. The information provided here may not be accurate for easy-pv.com.
This guide will detail how you can manage and create tariffs in Easy PV. Setting tariffs is an essential part of ensuring the financial benefits can be calculated as accurately as possible for your customer.
Tariffs can be created, viewed and edited in the consumption task or the financial task. You can also set up user level default tariffs in your account financial settings or if you are a member of a Pro team, this will be set by a Pro team admin in Pro account financial settings.
Creating a new tariff
Name of tariff
If this is a variable rate tariff, this name will show on the consumption section of the customer proposal. Otherwise, it is just a way for you to manage and navigate your tariffs when selecting them.
Scope of tariff
 |
Project level
|
 |
User level
|
 |
Team level
|
Once the scope of the tariff has been set, this cannot be edited.
Price bands
Flat tariff
- Input a value for the base rate and select save.
- If you're using £, ensure you're putting this in in the correct units, this value should be greater than 1 (i.e. 15, not 0.15).
Variable rate tariff and tariff periods
- The first band you enter will be used as the base rate - any time period that doesn't have a price band applied will be priced at this rate.
- Add any additional rates in the price bands section.
- In the tariffs period section you will be able to select the different price bands and indicate when they apply. For some tariffs different rates might apply at the weekend, you can select the days for which the tariff period applies.
Editing existing tariffs
You can view and edit your tariffs in three different places in your account:
- Within a project:
- Consumption task
- Financial task
- (Pro) Account settings > Financial (only User or Team-level tariffs)
When you select View and edit tariffs you will see the following options:
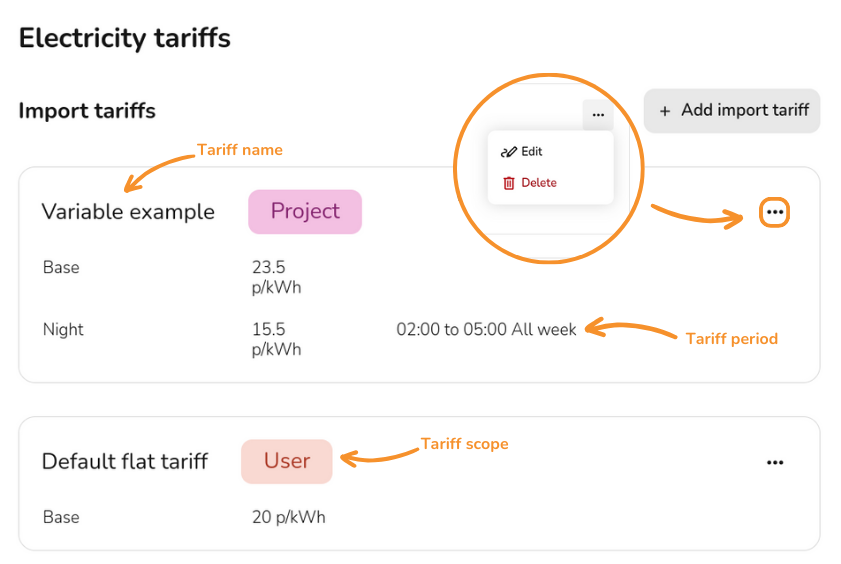
When editing tariffs you can change any of the details, except the tariff scope, but note that any changes you make will affect previous projects that use these tariffs.
Using your tariffs
Once you have created your tariff either for an individual project or set a user level default, you can then select these in the consumption task and financial task.